library(epiworldR)

# Initialize model
model_seir <- ModelSEIR("COVID-19",
                        prevalence = 0.01,
                        transmission_rate = 0.9,
                        recovery_rate = 1/4,
                        incubation_days = 4)

# Adding a small world population
agents_smallworld(
 model_seir,
 n = 10000,
 k = 5,
 d = FALSE,
 p = .01
 )

# Running model
run(model_seir, ndays = 100, seed = 1912)
_________________________________________________________________________
Running the model...
||||||||||||||||||||||||||||||||||||||||||||||||||||||||||||||||||||||||| done.
done.# Plotting
plot(model_seir)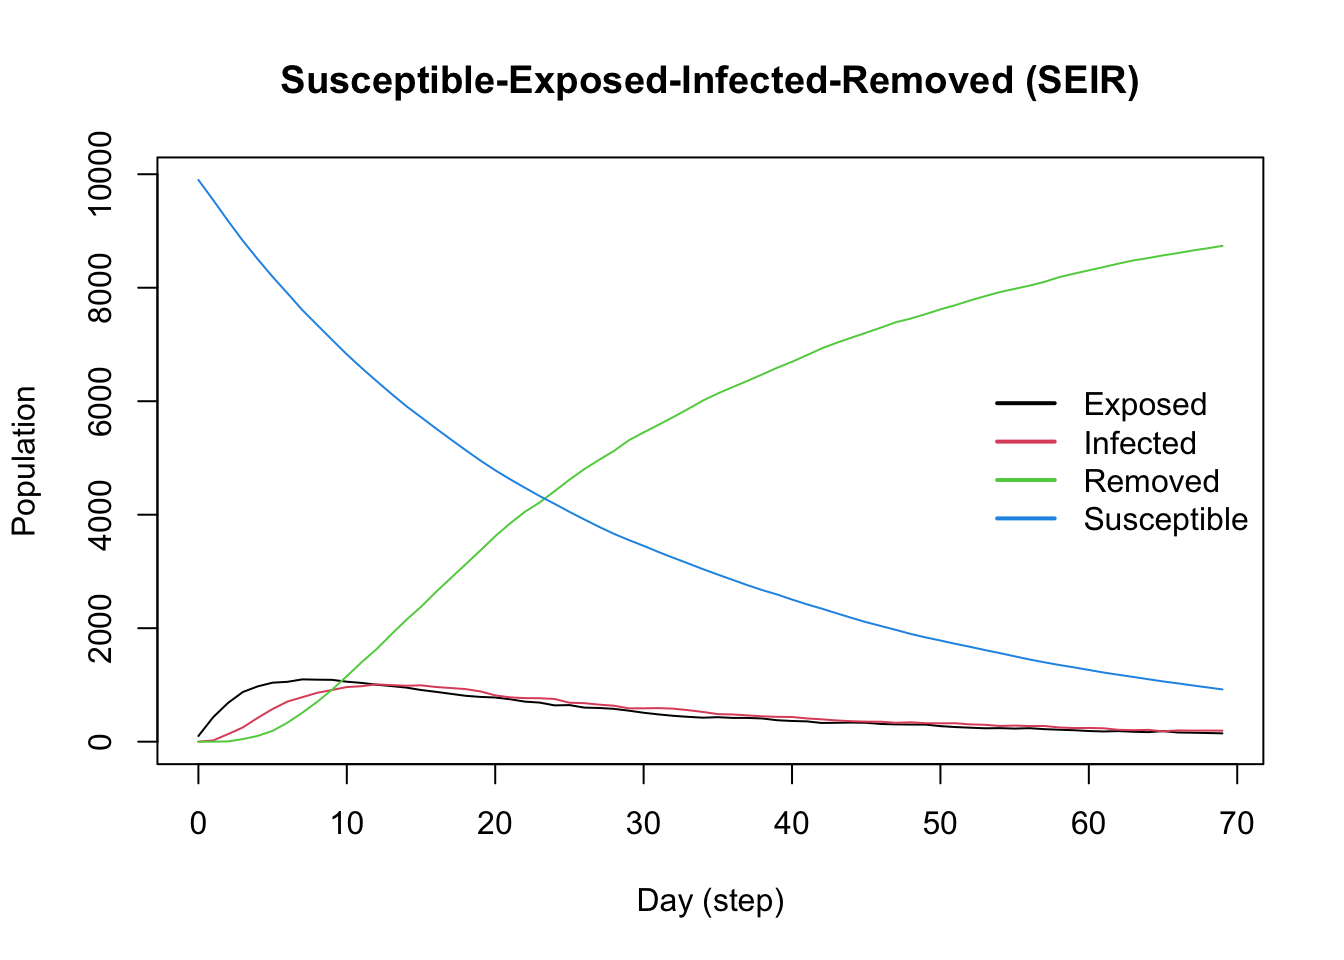
# Day of peak infections
x <- get_hist_total(model_seir)
which.max(x$counts[x$state == "Infected"]) - 1
[1] 12# Number of infections on peak day
max(x$counts[x$state == "Infected"])[1] 1010